User Commands - xy (1)
NAME
xy(1f) - [M_xyplot] Draw a basic XY plot (LICENSE:PD)
CONTENTS
Synopsis
Description
Options
Example
Author
License
SYNOPSIS
xy [ -f] FILE -xlabel STR -ylabel STR -d DEVICE -m NNNN -fn FILENAME -sz MARKER_SIZE
DESCRIPTION
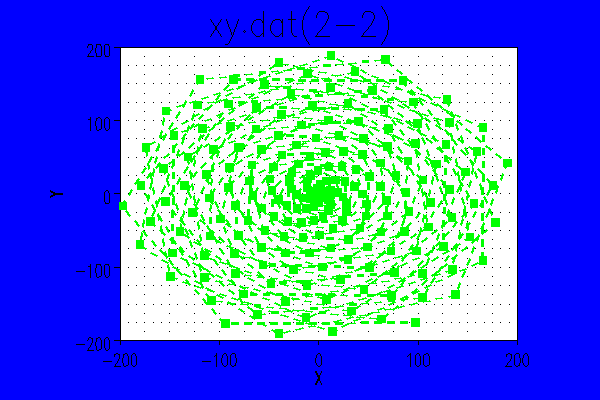
Create a basic XY plot from a simple ASCII table of numeric values. The first column is assumed to be the shared X values for the other columns.A plot of all Y columns is followed by a plot of each Y column by default.
If an interactive device is selected (X11, x11, xtek, tek, PC) then a pause occurs after each plot. Single character commands are
o q quit o n next o p previous o v toggle verbose mode o 0 redisplay plot of all curves
OPTIONS
-d M_draw(3fm) device name (X11,pdf,svg, ...). Enter the device name "list" for a list of available devices on an otherwise valid command. -f filename of format "X Y1 Y2 Y3 ..." -fn FNAME For file output, the default output name is xy.$DEVICE. If a name is specified containing a period it is used as-is. Otherwise the output file will be FNAME.$DEVICE -xlabel X-axis label. Default is "X" -ylabel Y-axis label. Default is "Y" -title plot title. Defaults to input filename -m NNN marker frequency. Place a marker at every nth point. The default is zero. Negative values suppress drawing the interconnecting lines. -sz marker size as a percent of display width. Default is 2.0 . -verbose display plot information to stdout -help display help text to stdout and exit -version display version to stdout and exit
EXAMPLE
Create a simple file with X and Y values and draw plot
      program demo_xy
      integer :: i10
      real :: x, y
         ! set up the data file
         open(unit=10,file=’xy.dat’)
         do i10=1,200
            x=i10*0.50
            y=x*sin(x)*100.0+400.0
            write(10,*)x,y,y+40.0,cos(y)*120.0+380.0
         enddo
         flush(10)
         call execute_command_line(’xy xy.dat -xlabel X-axis -ylabel Y-axis’)
         call execute_command_line(’xy xy.dat -xlabel X-axis -ylabel Y-axis -d pdf’)
         call execute_command_line(’xy xy.dat -xlabel X-axis -ylabel Y-axis -d svg’)
         close(10,status=’delete’)
      end program demo_xy
AUTHOR
John S. Urban
LICENSE
Public Domain
| Nemo Release 3.1 | xy (1) | June 29, 2025 |
