C Library Functions - scale (3)
NAME
scale(3f) - [M_calcomp:basic] calculate scaling factors for producing XY plots with LINE(3f) and AXIS(3f) routines (LICENSE:PD)
CONTENTS
Synopsis
Description
Options
Examples
License
SYNOPSIS
subroutine scale(array,axlen,npts,+-inc)
DESCRIPTION
Calculate scaling factors and a starting value for an array of X or Y values for use in producing XY plots with the LINE and AXIS routines, for example.
Typically, the user’s program will accumulate plotting data in two arrays:
o An array of independent variables, X(i) o An array of dependent variables, Y(i)=f(X(i)) Typically these values should not be drawn directly in units of inches, but should be rescaled (A temperature of 3000 should not require the generation of a 3000 inch plot!).
For some problems the range of data is predictable. The programmer can predetermine suitable conversion factors for use in drawing the axis scale values and plot the data points on the graph directly in units of inches using the PLOT routine. Usually, however, these factors are not known in advance.
Therefore, the SCALE subroutine can examine the data values in an array and determine a starting value (minimum or maximum) and a scaling factor (positive or negative) such that:
1. The scale numbers drawn by the AXIS subroutine at each division will properly represent the range of real data values in the array. 2. The data points, when plotted by the LINE subroutine, will fit in a given plotting area (Generally the bounds of the plot axis drawn with AXIS). These values are computed and stored by SCALE at the END OF THE INPUT VALUE ARRAY.
The computed scaling factor (DELTAV) represents the number of data units per inch of axis, adjusting DELTAV so that it is always an interval of 1, 2, 4, 5, or 8 x 10**n (where n is an exponent consistent with the original unadjusted scaling factor). Thus, an array may have a range of values from 301 to 912, to be plotted over an axis of 10 inches. The unadjusted scaling factor is (912-301)/10=61.1 units/inch. The adjusted DELTAV would be 8 x 10**1 = 80. This will allow the production of ’nice’ axes, that start and end on rounded units and are divided into increments people can easily interpolate between.
The starting value (FIRSTV) is intended to be used as the first numeric label on the axis, is computed as a multiple of DELTAV that is equal to or outside the limits of the data in the array. For the example given above, if a minimum is wanted for FIRSTV, 240 would be chosen as the best value. If a maximum is desired instead, 960 would be selected (The nearest multiple of 80=DELTAV that is below or above the minimum and maximum data values 301 and 912).
OPTIONS
ARRAY is the first element of the array of data points to be examined. AXLEN is the length of the axis, in inches, to which the data is to be scaled. Its value must be greater than 1.0 inch, and less than 100 inches. NPTS is the number of data values to be scanned in the array. The FORTRAN DIMENSION statement must specify at least two elements more than the number of values being scaled, to allow room for SCALE to store the computed starting value and scaling factor at the end of the array. +-INC is an integer whose magnitude is used by SCALE as the increment with which to select the data values to be scaled in the array. Normally INC=1; if it is 2, every other value is examined. If INC is positive, the selected starting value (FIRSTV) approximates a minimum, and the scale factor (DELTAV) is positive.
If INC is negative, the selected starting value (FIRSTV) approximates a maximum, and the scaling factor (DELTAV) is negative.
WARNING
If INC= +-1, the array must be dimensioned at least two elements larger than the actual number of data values it contains. If the magnitude of INC > 1, the computed values are stored at (INC) elements and (2*INC) elements beyond the last data point. The subscripted element for FIRSTV is ARRAY(NPTS*INC+1); for DELTAV it is ARRAY (NPTS*INC+INC+1). Therefore, ARRAY must always be dimensioned at least NPTS*INC+INC+1 .
Generally, SCALE is called to examine each array to be plotted. If the user knows the range of his data values, he does not have to call SCALE for that array so long as he supplies an appropriate FIRSTV and DELTAV when AXIS and LINE are called.
EXAMPLES
Sample program:
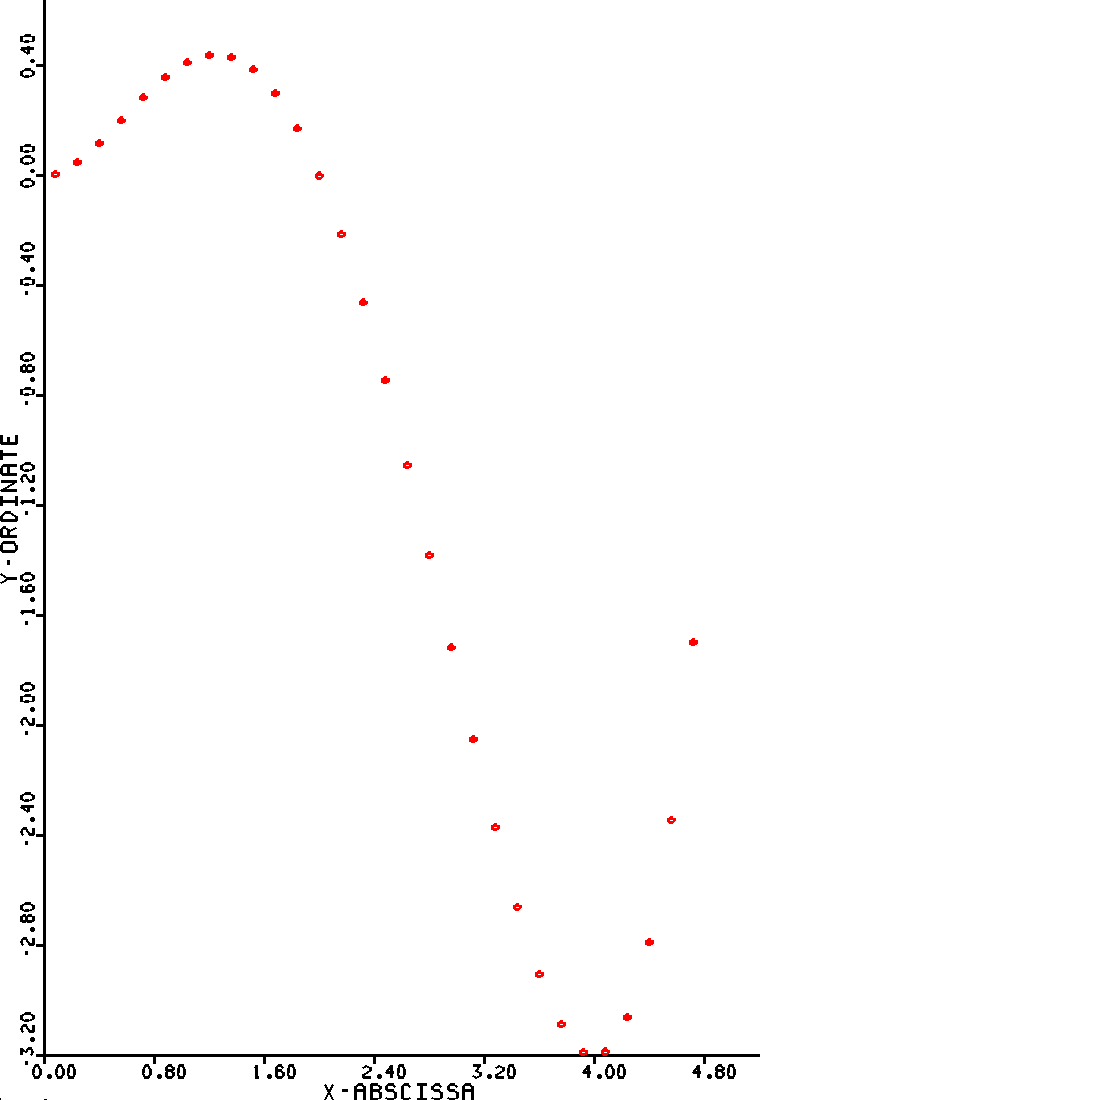
program demo_scale use M_calcomp implicit none character(len=28) :: ichr1 character(len=26) :: ichr2 character(len=10) :: lbcd1, lbcd2 real :: xarray, yarray dimension xarray(62), yarray(62) real :: deltax integer :: i, j, inteq ICHR1 = ’PLOTTED ON A CALCOMP PLOTTER’ ICHR2 = ’USING Y = X -0.7*X +0.1*X’ LBCD1 = ’X-ABSCISSA’ LBCD2 = ’Y-ORDINATE’ call plots(0.0, 10.0, 0.0, 10.0) ! PLOT THREE GRAPHS ILLUSTRATING SCALE, AXIS, AND LINE deltax = 0.04 i = 1 ! AXIS DRAWS LABELS AS MUCH AS 0.4 INCHES TO THE NEGATIVE OF AXIS CENTER; ! EITHER USE AN ORIGIN OFFSET OF AT LEAST THIS VALUE OR DO NOT USE AN ! ORIGIN VALUE OF LESS THAN 0.4 OR CLIPPING WILL OCCUR call plot(0.4, 0.4, -3) deltax = 2.0*deltax xarray(1) = deltax do j = 1, 60 yarray(j) = xarray(j)**2 - 0.7*xarray(j)**3 + 0.1*xarray(j)**4 xarray(j + 1) = xarray(j) + deltax end do call scale(xarray(1), 6.5, 60, 1) call scale(yarray(1), 10.0, 60, 1) call axis(0.0, 0.0, lbcd1, -10, 6.5, 0.0, xarray(61), xarray(62)) call axis(0.0, 0.0, lbcd2, 10, 10.0, 90.0, yarray(61), yarray(62)) call newpen(i) call line(xarray(1), yarray(1), 60, 1, 2*(i - 2), i) call newpen(1) call symbol(1.3, 10., .14, ichr1, inteq, 0.0, 28) call symbol(1.3, 9.7, .14, ichr2, inteq, 0.0, 26) call number(2.98, 9.8, .1, 2.0, 0., -1) call number(3.96, 9.8, .1, 3.0, 0., -1) call number(4.94, 9.8, .1, 4.0, 0., -1)end program demo_scale!call plot(10.0,0.0,-3) call plot(0.0, 0.0, 999)
LICENSE
Public Domain
| Nemo Release 3.1 | scale (3) | June 29, 2025 |
