C Library Functions - polar (3)
NAME
polar(3f) - [M_calcomp:scientific] plot radial values versus angular variables (as polar coordinates) (LICENSE:PD)
CONTENTS
Synopsis
Description
Options
Comments
Examples
License
SYNOPSIS
subroutine polar(radar,angar,npts,inc,+-lintyp,inteq,rmax,dr)
DESCRIPTION
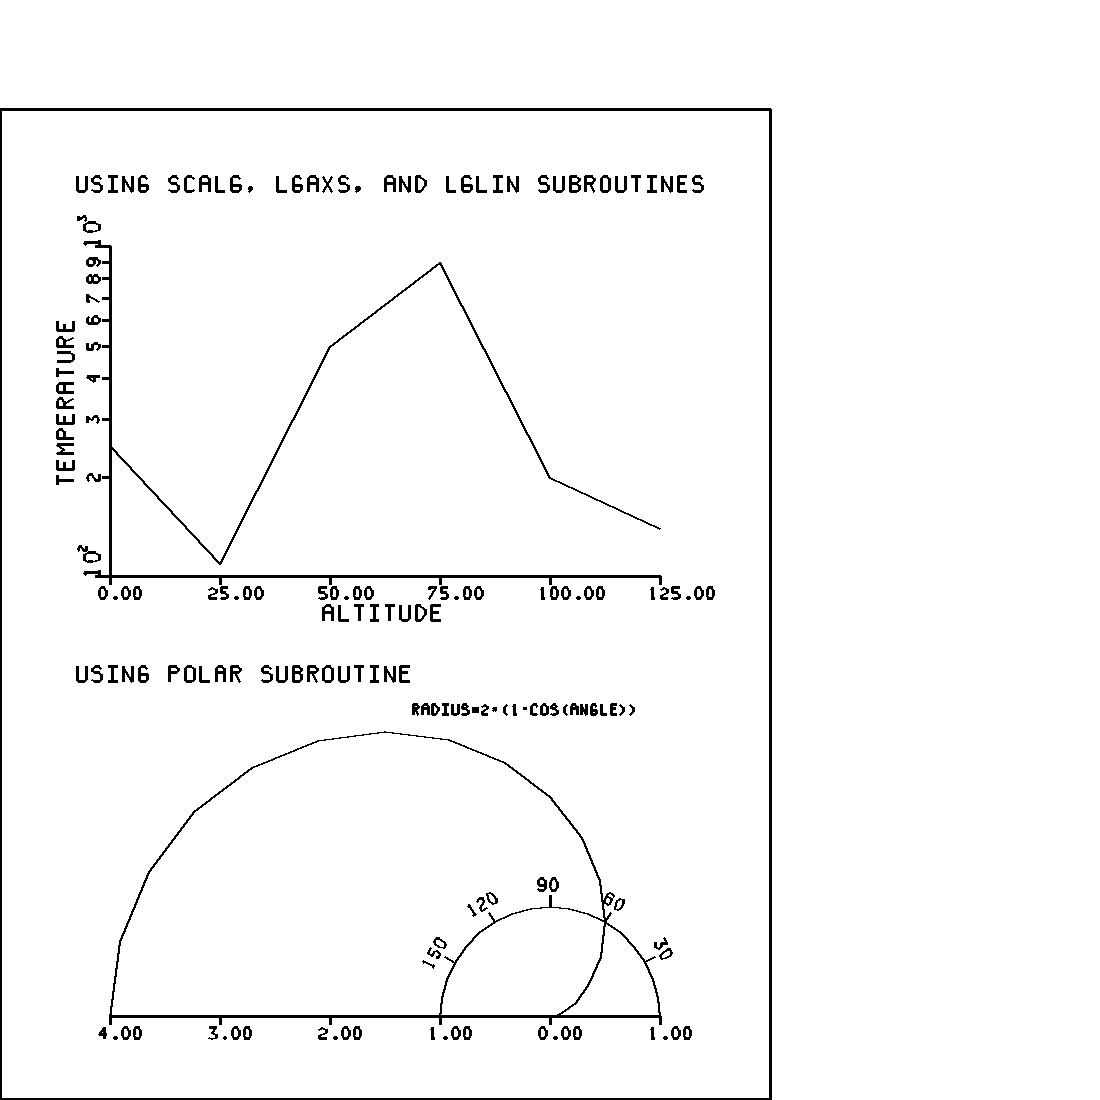
POLAR is a FORTRAN subroutine which scales and plots a radial variable of any magnitude against an angular variable (angle in radians) as polar coordinates. POLAR produces either a line plot (with lines connecting data points) or a point plot, centered at (0.0).
OPTIONS
RADAR is the name of the array containing the radial values. ANGAR is the name of the array containing the angular values (radians). NPTS is the number of data points to be plotted. INC is the increment between elements in the array. INC is greater than 1 if the values to be plotted are in a mixed array. Every INCth point in the array is plotted. (Normally INC = 1). RADAR and ANGAR must be dimensioned to be INC*NPTS words long. LINTYP is used to control the type of graph produced: If LINTYP = 0 a line is plotted between successive data points. No symbols are plotted.If LINTYP = 1 a line plot is produced, with a symbol at each data point.
If LINTYP = n a line plot is produced, with symbol at every nth data point.
If LINTYP = -n, connecting lines are not plotted between data points; a symbol appears at every nth data point.
INTEQ is the integer equivalent used to specify the symbol to be plotted at the data point. (Refer to the description of SYMBOL for possible values of INTEQ). RMAX is the maximum radius for the plotting area, in page inches. If RMAX<=(0), DR is used as scale factor. DR is the scale factor. If RMAX>0, DR is computed by the POLAR subroutine; if RMAX<=(0), DR must contain the scale factor. DR is expressed in units of data per page inch.
COMMENTS
Angles are measured in radians counterclockwise around (0.0,0.0), with zero being in the +X direction.
Radial values are measured from (0.0,0.0), with negative values being plotted radially opposite from positive values.
EXAMPLES
Sample program:
   program demo_polar
   use M_calcomp
   implicit none
   ! based on concepts of CALIFORNIA COMPUTER PRODUCTS, 1968
   character(len=50) :: ibcd
   integer           :: i, k
   integer           :: inteq
   real              :: a
   real              :: angl
   real              :: angle(19)
   real              :: bang
   real              :: beta
   real              :: r(19)
   real              :: theta
   real              :: x
   real              :: xx
   real              :: xa,ya, xb,yb, xc,yc, xd,yd
   real              :: xar(8)= [ 1.00, 2.00, 3.00, 4.00, 5.00, 6.00       , 0.0, 0.0 ]
   real              :: yar(8)= [ 250.0, 110.0, 500.0, 900.0, 200.0, 140.0 , 0.0, 1.0 ]
      call plots(0.0,10.0,0.0,10.0)
   ! DRAW FRAME
      call plot(7.0,0.0,2)
      call plot(7.0,9.0,2)
      call plot(0.0,9.0,2)
      call plot(0.0,0.0,2)
   ! DRAW COMMENTS
      ibcd=’USING SCALG, LGAXS, AND LGLIN SUBROUTINES’
      call symbol(0.7,8.25,0.14,ibcd,inteq,0.0,42)
      ibcd=’USING POLAR SUBROUTINE’
      call symbol(0.7,3.80,0.14,ibcd,inteq,0.0,22)
   ! AXIS IS DRAWN
      ibcd=’ALTITUDE’
      call axis(1.0,4.75,ibcd,-8,5.0,0.0,0.0,25.0)
      call scalg(yar,3.0,6,1)
      ibcd=’TEMPERATURE’
      call lgaxs(1.0,4.75,ibcd,11,3.0,90.0,yar(7),yar(8))
      call scale(xar,5.0,6,1)
      call plot(1.0,4.75,-3)
      call lglin(xar,yar,6,1,0,1,1)
      call plot(-1.0,-4.75,-3)
   ! POLAR SUBROUTINE IS USED
      x=0.0
      do k=1,19
         theta=x*0.0174533
         r(k)=2.0*(1.0-cos(theta))
         angle(k)=theta
         x=x+10.0
      enddo
      call plot(5.0,0.75,-3)
      call polar(r,angle,19,1,0,1,0.0,1.0)
      angl =30.0
      a=1.0
      do  i=1,5
         theta=angl *0.0174533
         xa=cos(theta)
         ya=sin(theta)
         call plot(xa,ya,3)
         xb=1.1*xa
         yb=1.1*ya
         call plot(xb,yb,2)
         xc=xb+0.05*xa
         yc=yb+0.05*ya
         if((i-3).gt.0)then
            a=1.5
         endif
         beta=1.570797-theta
         xd=xc-0.105*a*cos(beta)
         yd=yc+0.105*a*sin(beta)
         bang=270.0+angl
         call number(xd,yd,0.105,angl, bang,-1)
         angl =angl +30.0
      enddo
      xx=0.0
      do i=1,19
         angle(i) = xx*0.0174533
         r(i) = 1.0
         xx=xx+10.0
      enddo
      call polar(r,angle,19,1,0,1,0.0,1.0)
      call plot(-5.0,-0.75,-3)
   ! AXIS IS DRAWN
      ibcd=’’
      call axis(1.0,0.75,ibcd,-1,4.0,0.0,4.0,-1.0)
      call axis(5.0,0.75,ibcd,-1,1.0,0.0,0.0,1.0)
      ibcd=’RADIUS=2*(1-COS(ANGLE))’
      call symbol(3.75,3.5,0.09,ibcd,inteq,0.0,23)
      call plot(11.0,0.0,999)
   end program demo_polar
LICENSE
Public Domain
| Nemo Release 3.1 | polar (3) | June 29, 2025 |