C Library Functions - factor (3)
NAME
factor(3f) - [M_calcomp:basic] rescale entire plot (LICENSE:PD)
CONTENTS
Synopsis
Description
Options
Examples
License
SYNOPSIS
subroutine factor(fact)
DESCRIPTION
Subroutine FACTOR enables the user to enlarge or reduce the size of the entire plot by changing the ratio of the desired plot size to the normal plot size. FACTOR is often called only once in a program, immediately after the initialization call to PLOTS, to rescale all plotting to a single specific scale.
Because CALCOMP inches are unit-less units in PDF files, this routine is not necessary unless inch units greater than 100 are needed (100 is maximum PDF frame size) or if the program needs to remain portable to standard true-inch CALCOMP libraries and using the actual values used in the PLOT calls would produce a very small or very large plot.
USERS TRYING TO PRODUCE TRUE INCHES PLEASE NOTE:
In this CALCOMP, all frames are scaled individually to the maximum size obtainable on the output device they are produced on. This means to keep frames scaled relative to each other, you must move to the same maximum XY value IN EACH FRAME (see routine NFRAME description) with a call to PLOTS so that each frame is the same number of unit-less units in size. An example program at the end of this manual illustrates keeping frames scaled relative to each other.
OPTIONS
FACT is the ratio of the desired plot size to the normal plot size. For example, if FACT=2.0, all subsequent pen movements will be twice their normal size. When FACT is reset to 1.0, all plotting returns to normal size. During the debugging of a plotting application program, plotting time can be saved by reducing the size of the entire plot output on certain devices such as pen plotters. This is done by calling FACTOR with a value less than 1.0 after calling PLOTS. When debugging is completed, this call statement can be removed.
EXAMPLES
Sample program:
   program demo_factor
   use M_calcomp, only : plots, plot, number, symbol, newpen
   use M_calcomp, only : nframe, factor, rect
   use M_calcomp, only : MOVE, END, DRAW
   implicit none
   call plots(0.0,10.0,0.0,10.0)
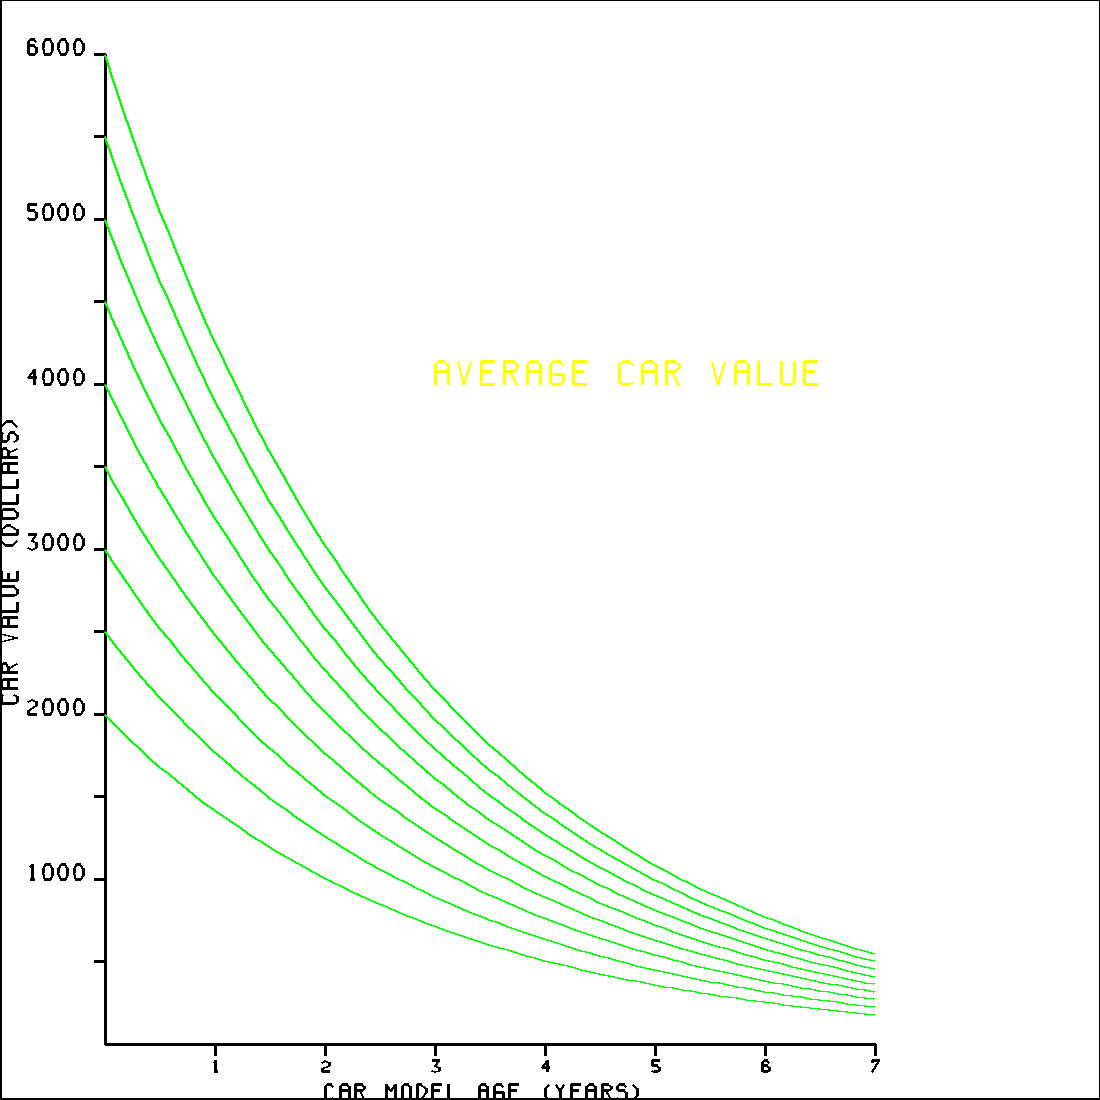
   call draw_car_prices()
   call nframe()
   call factor(0.5)
   call draw_car_prices()
   call plot( 5.0, 5.0,-3)
   call factor(0.5)
   call draw_car_prices()
   call plot(0.0,0.0,end)
   contains
   subroutine draw_car_prices()
      character(len=21) :: ichr6
      character(len=19) :: ichr7
      character(len=17) :: ichr8
      real :: x, y, value, age
      integer :: i, j, inteq
      ichr6=’CAR MODEL AGE (YEARS)’
      ichr7=’CAR VALUE (DOLLARS)’
      ichr8=’AVERAGE CAR VALUE’
      !     CALL TO SYMBOL USES -0.5Y, -0.8-.14  X
      !     (-.14 FOR CHARACTER HEIGHT)
      call rect(0.0,0.0,10.0,10.0,0.0,7)
      call plot(0.95,0.5,-MOVE)
      ! PLOT CAR VALUE CHART WITHOUT USING SCALE,AXIS,OR LINE
      x=1.0
      ! PLOT X-AXIS
      do i=1,7
         call plot(x-1.0,0.0,MOVE)
         call plot(x   , 0.0,DRAW)
         call plot(x   ,-0.1,DRAW)
         call number(x-.02,-0.25,0.1,x,0.0,-1)
         x=x+1.0
      enddo
      call symbol(2.0,-0.5,0.14,ichr6,inteq,0.0,21)
      ! PLOT Y-AXIS
      value=1000.0
      do i=1,6
         y=0.0015*value
         call plot(0.0,y-1.5,MOVE)
         call plot(0.0,y-.75,DRAW)
         call plot(-.1,y-.75,DRAW)
         call plot(0.0,y-.75,DRAW)
         call plot(0.0,y    ,DRAW)
         call plot(-.1,y    ,DRAW)
         call number(-0.7,y,0.14,value,0.0,-1)
         value=value+1000.0
      enddo
      call symbol(-0.8,3.1,0.14,ichr7,inteq,90.0,19)
      ! PLOT CURVES
      call newpen(2)
      do i=2000,6000,500
         value=i
         age=0.0
         call plot(age,0.0015*value,MOVE)
         do j=1,84
            value=value*0.972
            age=age+0.08333
            call plot(age,0.0015*value,DRAW)
         enddo
      enddo
      call newpen(3)
      call symbol(3.0,6.0,0.21,ichr8,inteq,0.0,17)
      end subroutine draw_car_prices
      end program demo_factor
LICENSE
Public Domain
| Nemo Release 3.1 | factor (3) | June 29, 2025 |
