C Library Functions - dashl (3)
NAME
dashl(3f) - [M_calcomp:general] draws a polyline with dashed lines (LICENSE:PD)
CONTENTS
Synopsis
Description
Options
Comments
Examples
License
SYNOPSIS
subroutine dashl(xarray,yarray,npts,inc)
DESCRIPTION
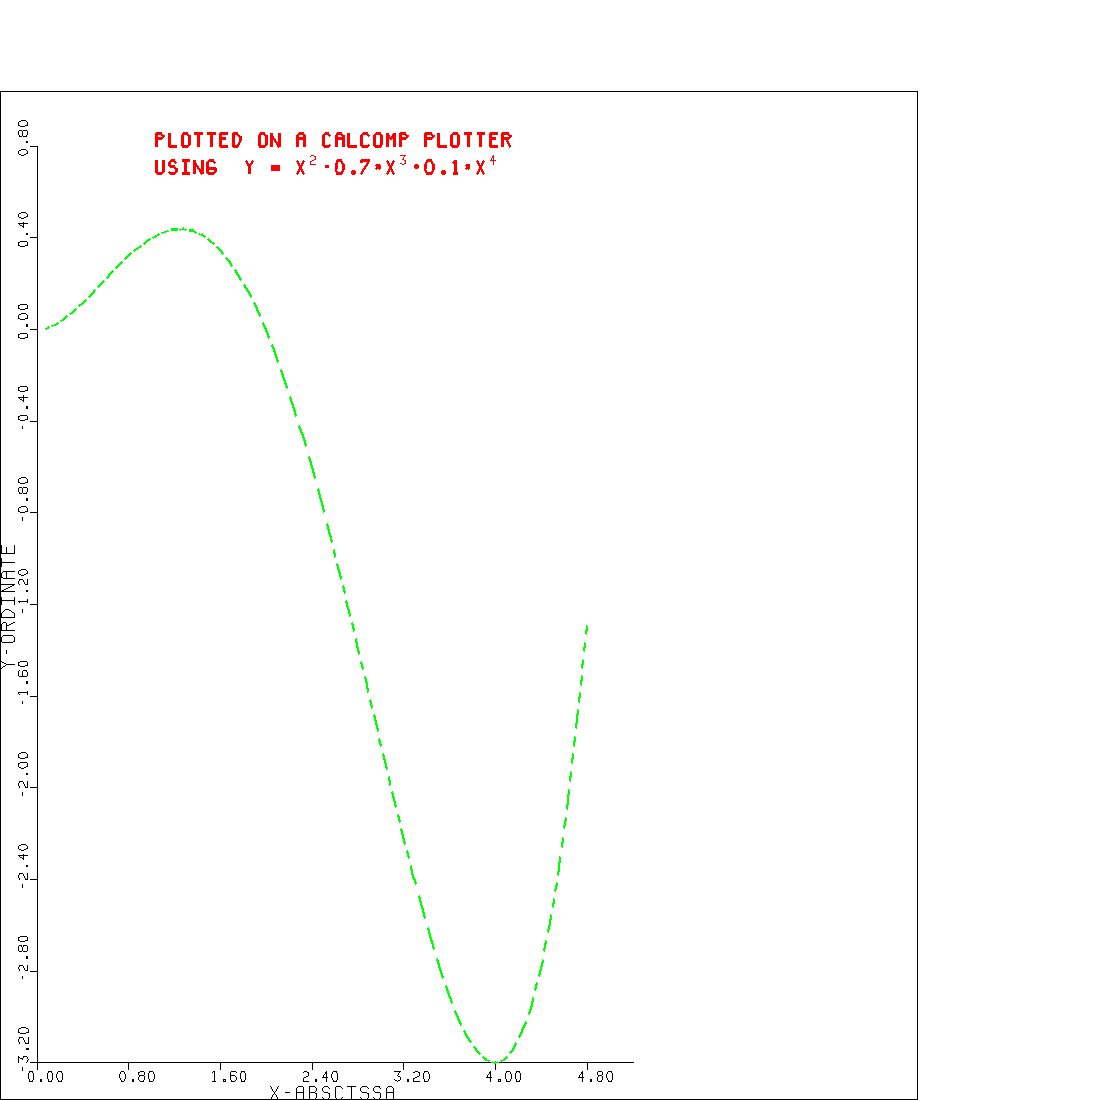
DASHL is a FORTRAN subroutine which draws dashed lines connecting a series of data points. Its operation is similar to that of the LINE subroutine.
OPTIONS
XARRAY is the name of the array containing abscissas (X values) of the data points to be plotted and the scaling parameters for the X array. YARRAY is the name of the array containing ordinates (Y values) of the data points to be plotted and the scaling parameters for the Y array. NPTS is the quantity of data points to be plotted. INC is the increment between array elements to be plotted. INC is greater than 1 if the values to be plotted are in a mixed or multi-dimensioned array. (Normally INC = 1).
COMMENTS
The arrays must be dimensioned with at least NPTS + 2 elements. The adjusted minimum value (FIRSTV) and the adjusted delta value (DELTAV), normally provided by the SCALE subroutine, must be stored following the data array.
For the X array, the adjusted minimum is stored in XARRAY(NPTS*INC+1), and the adjusted delta is in XARRAY(NPTS*INC+INC+1). Similarly, for the Y array, the minimum is in YARRAY(NPTS*INC+1), and the delta is in YARRAY(NPTS*INC+INC+1). Therefore, XARRAY and YARRAY must be dimensioned to be at least NPTS*INC+INC+1 .
If scaling is not required, the user must place the appropriate minimum and delta values in the specified elements of the arrays. For a one-to-one correspondence between array data and plotted data, these values should be 0.0 (minimum) and 1.0 (delta).
A dashed line, with dashes approximately 0.1 inch long, is drawn connecting sequential points. Coding is optimized so that plotting may either begin at the first point and progress forward or begin at the last point and progress backward.
EXAMPLES
Sample program
   program demo_dashl
   use m_calcomp
   implicit none
   character(len=28) :: ichr1
   character(len=26) :: ichr2
   character(len=10) :: lbcd1,lbcd2
   real :: xarray(62),yarray(62)
   real :: deltax
   integer :: j, inteq
   ichr1=’PLOTTED ON A CALCOMP PLOTTER’
   ichr2=’USING  Y = X -0.7*X +0.1*X’
   lbcd1=’X-ABSCISSA’
   lbcd2=’Y-ORDINATE’
   ! PLOT GRAPH ILLUSTRATING SCALE, AXIS, AND LINE
   deltax=0.04
   ! AXIS DRAWS LABELS AS MUCH AS 0.4 INCHES TO THE NEGATIVE OF AXIS CENTER;
   ! EITHER USE AN ORIGIN OFFSET OF AT LEAST THIS VALUE OR DO NOT USE AN
   ! ORIGIN VALUE OF LESS THAN 0.4 OR CLIPPING WILL OCCUR
   call plots(0.0,12.0,0.0,12.0)
   call width(0)
   call newpen(white)
   call rect(0.0,0.0,11.0,10.0,0.0,7)
   call plot(0.4,0.4,-move)
   deltax=2.0*deltax
   xarray(1)=deltax
   do j=1,60
      yarray(j)=xarray(j)**2-0.7*xarray(j)**3+0.1*xarray(j)**4
      xarray(j+1)=xarray(j)+deltax
   enddo
   call scale(xarray(1), 6.5,60,1)
   call scale(yarray(1),10.0,60,1)
   call axis(0.0,0.0,lbcd1,-10, 6.5, 0.0,xarray(61),xarray(62))
   call axis(0.0,0.0,lbcd2, 10,10.0,90.0,yarray(61),yarray(62))
   call width(20)
   !!call newpen(RED)
   !!linetype=-1
   !!inteq=4
   !!call line(xarray(1),yarray(1),60,1,linetype,inteq)
   call newpen(green)
   call dashl(xarray(1),yarray(1),60,1)
   call newpen(1)
   call symbol(1.3,10.,.14,ichr1,inteq,0.0,28)
   call symbol(1.3,9.7,.14,ichr2,inteq,0.0,26)
   call width(0)
   call number(2.98,9.8,.1,2.0,0.,-1)
   call number(3.96,9.8,.1,3.0,0.,-1)
   call number(4.94,9.8,.1,4.0,0.,-1)
   call plot(0.0,0.0,end)
   end program demo_dashl
LICENSE
Public Domain
| Nemo Release 3.1 | dashl (3) | June 29, 2025 |
