C Library Functions - curvy (3)
NAME
curvy(3f) - [M_calcomp:scientific] plots a function of Y over a given range (LICENSE:PD)
CONTENTS
Synopsis
Description
Options
Examples
License
SYNOPSIS
subroutine curvy(yo,yf,coeff1,exp1,coeff2,exp2,coeff3,exp3,coeff4,exp4)
DESCRIPTION
CURVY is a FORTRAN subroutine which plots a function of Y over a given range.
OPTIONS
YO,YF are the starting and ending values of Y. (These are assumed to be inches.) COEFF1,COEFF2,COEFF3,COEFF4 are the coefficients of the polynomial that defines the function to be plotted. EXP1,EXP2,EXP3,EXP4 are the exponents of the polynomial that defines the function to be plotted.
COMMENTS
The polynomial that defines the function to be plotted is:
X=COEFF1*Y**EXP1+COEFF2*Y**EXP2+COEFF3*Y**EXP3+COEFF4*Y**EXP4for values of Y from YO to YF, where deltaY=0.01. Since values of Y are assumed to be inches, any scaling required must be performed before calling this subroutine.
If Y is zero or negative, errors may be generated.
EXAMPLES
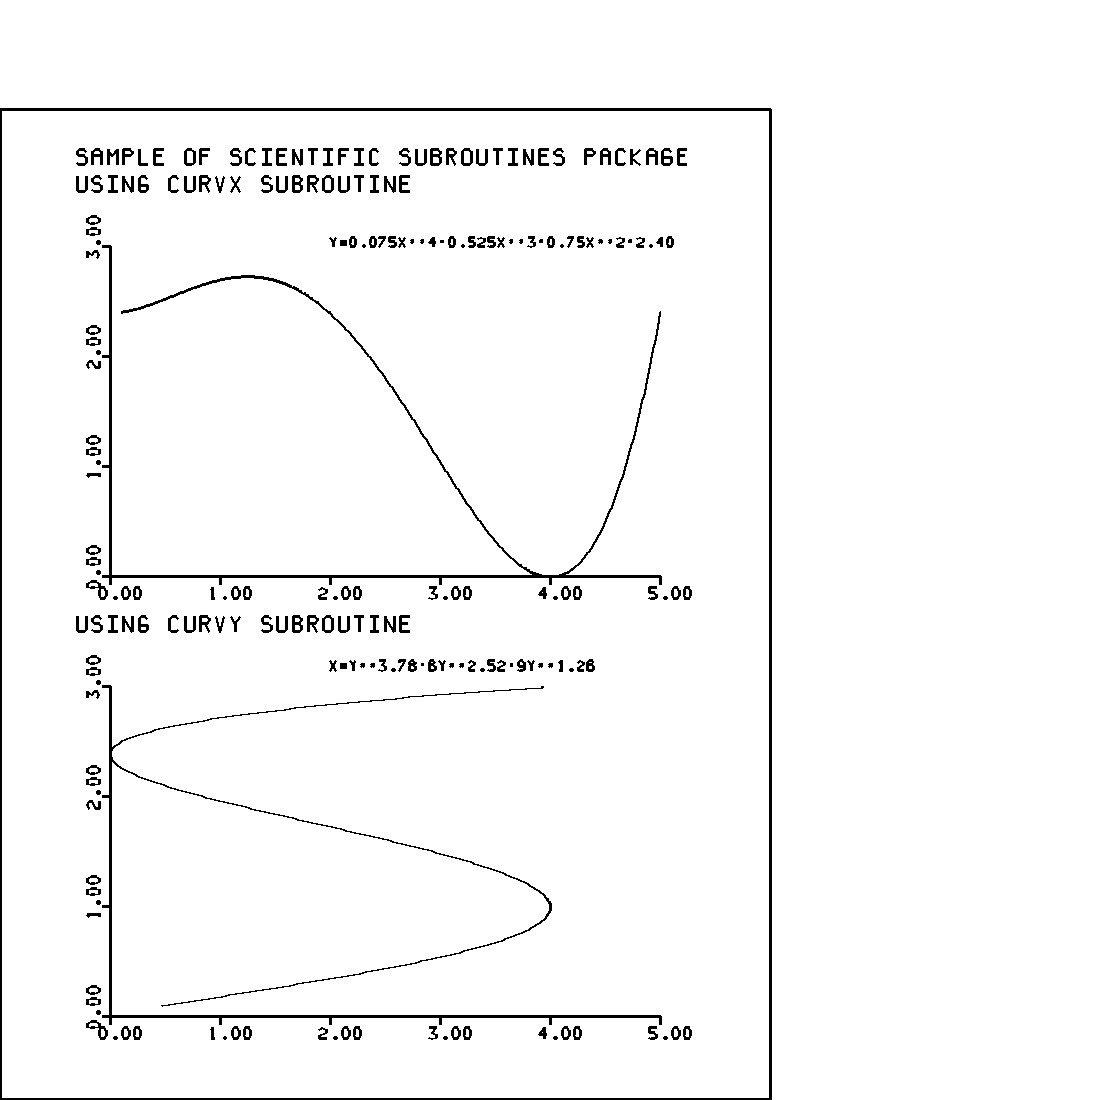
Sample program
   program demo_curvx
   use M_calcomp
   implicit none
   ! based on concepts of CALIFORNIA COMPUTER PRODUCTS, 1968
   character(len=50) :: ibcd
   integer           :: inteq
   ! INITIALIZE GRAPHICS
      call plots(0.0,10.0,0.0,10.0)
   ! DRAW FRAME
      call plot(7.0,0.0,2)
      call plot(7.0,9.0,2)
      call plot(0.0,9.0,2)
      call plot(0.0,0.0,2)
   ! COMMENTS ARE INSERTED
      ibcd=’SAMPLE OF SCIENTIFIC SUBROUTINES PACKAGE’
      call symbol(0.7,8.5,0.14,ibcd,inteq,0.0,40)
      ibcd=’USING CURVY SUBROUTINE’
      call symbol(0.7,4.25,0.14,ibcd,inteq,0.0,23)
      ibcd=’USING CURVX SUBROUTINE’
      call symbol(0.7,8.25,0.14,ibcd,inteq,0.0,23)
   ! TWO PAIRS OF AXES ARE DRAWN
      ibcd=’’
      call axis(1.0,4.75,ibcd,-1,5.0,0.0,0.0,1.0)
      call axis(1.0,4.75,ibcd, 1,3.0,90.0,0.0,1.0)
      call axis(1.0,0.75,ibcd,-1,5.0,0.0,0.0,1.0)
      call axis(1.0,0.75,ibcd, 1,3.0,90.0,0.0,1.0)
   ! CURVX IS DRAWN
      call plot(1.0,4.75,-3)
      call curvx(0.1,5.0,2.40,0.0,0.75,2.0,-0.525,3.0,0.075,4.0)
      call plot(-1.0,-4.75,-3)
   ! CURVY IS DRAWN
      call plot(1.0,0.75,-3)
      call curvy(0.1,3.0,9.0,1.26,-6.0,2.52,1.0,3.78,0.0,0.0)
      call plot(-1.0,-0.75,-3)
   ! EQUATIONS ARE DRAWN
      ibcd=’Y=0.075X**4-0.525X**3+0.75X**2+2.40’
      call symbol(3.0,7.75,0.09,ibcd,inteq,0.0,35)
      ibcd=’X=Y**3.78-6Y**2.52+9Y**1.26’
      call symbol(3.0,3.90,0.09,ibcd,inteq,0.0,27)
      call nframe()
   !  CLOSE GRAPHICS
      call plot(11.0,0.0,999)
   end program demo_curvx
LICENSE
Public Domain
| Nemo Release 3.1 | curvy (3) | June 29, 2025 |
